4. Search Logs
Now that we are sending logs from CloudWatch to OpenSearch lets create an index patterns and run a simple search to validate that our logs are actually being sent to OpenSearch.
OpenSearch is capable of more than search it can also build visualizations and more. In this section we will perform a simple search to ensure that our logs are actually being delivered.
Check out the Visualize and Analyze section of the OpenSearch Log Analytics workshop for a more thorough lab on searching and visualizing logs.
Open the OpenSearch Dashboard
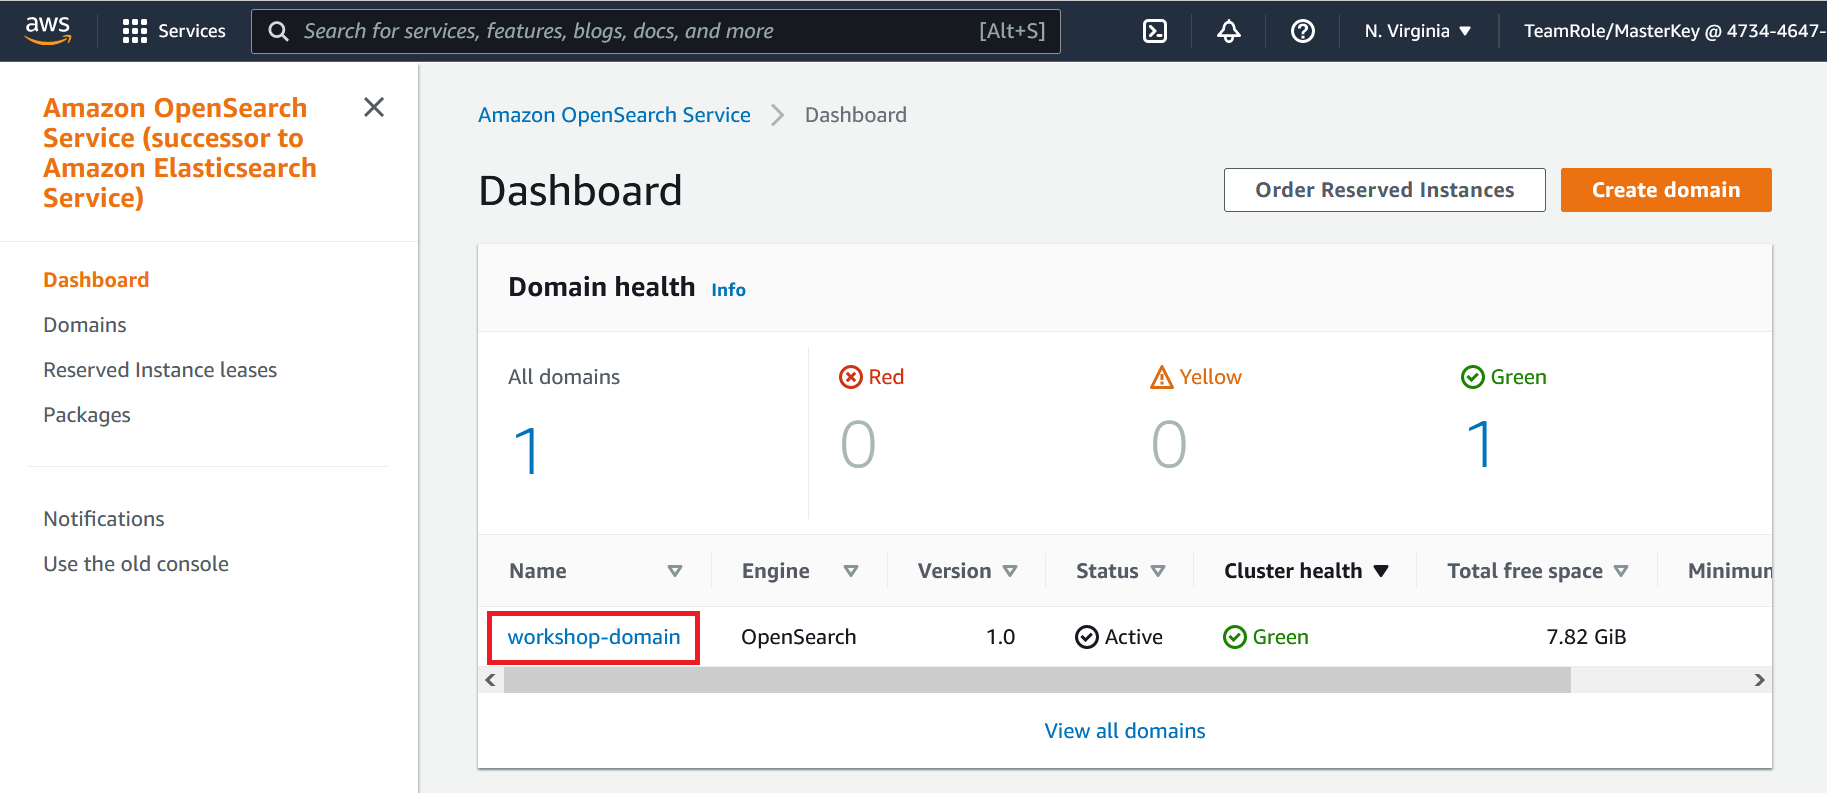
- Go to the OpenSearch Console
- Click on the workshop-domain OpenSearch domain you created earlier
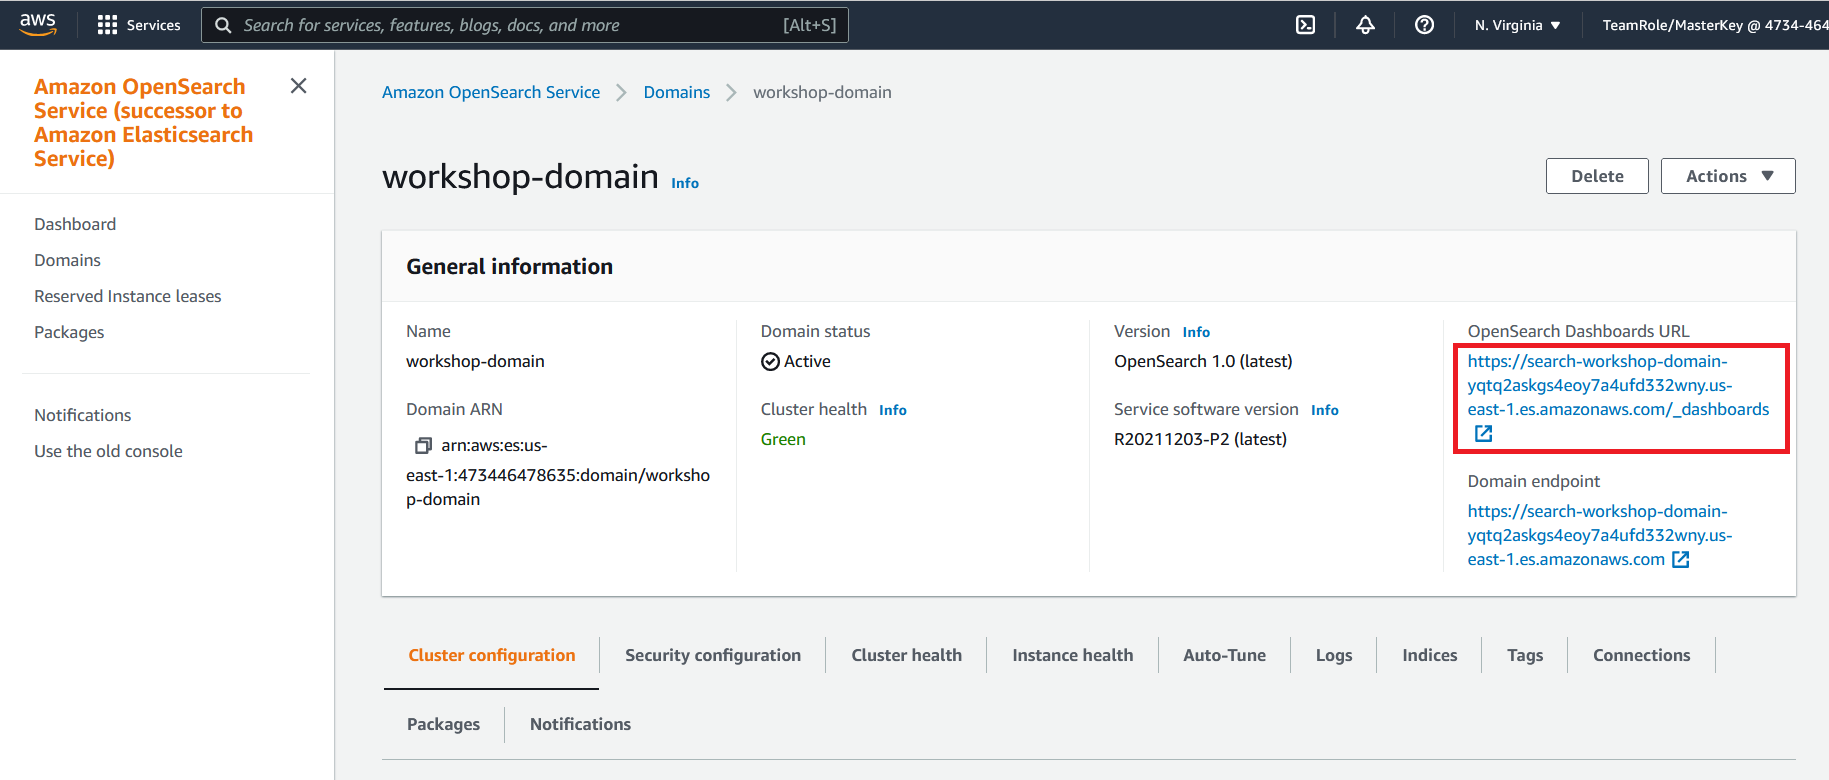
- Click on the OpenSearch Dashboard URL. This should open the URL in a web browser window
- You will be prompted to log in. Using the user name and password you created during the OpenSearch deployment, log in
- If an additional pop up window is present after login asking about data upload click on Explore on my own
- If an additional pop up windows is present asking you to select your tenant select Global and click on Confirm
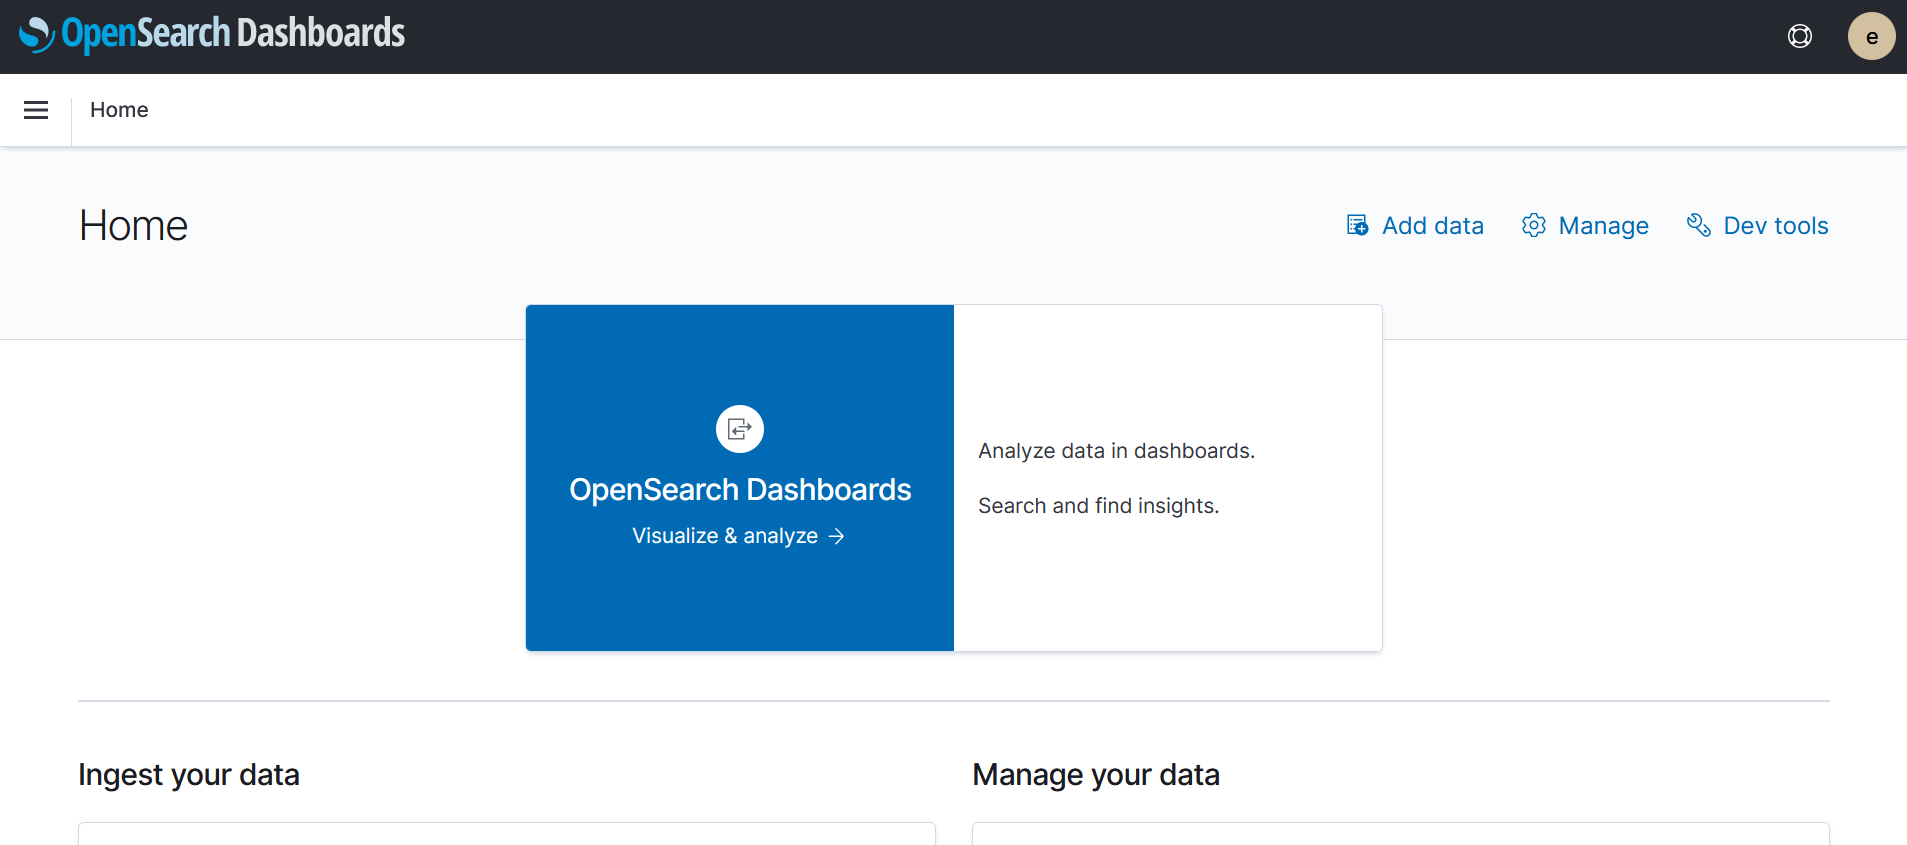
You should now see a window that looks like this
Create an Index Pattern
The Lambda functions the send the messages from CloudWatch to OpenSearch will create a new OpenSearch index each day. Each index name will start with cwl and will be followed by the date.
To search all of the CloudWatch logs (ie. multiple days) we will create an index pattern in OpenSearch. The index pattern will be a representation of all of the cwl log indexes for all of the days.
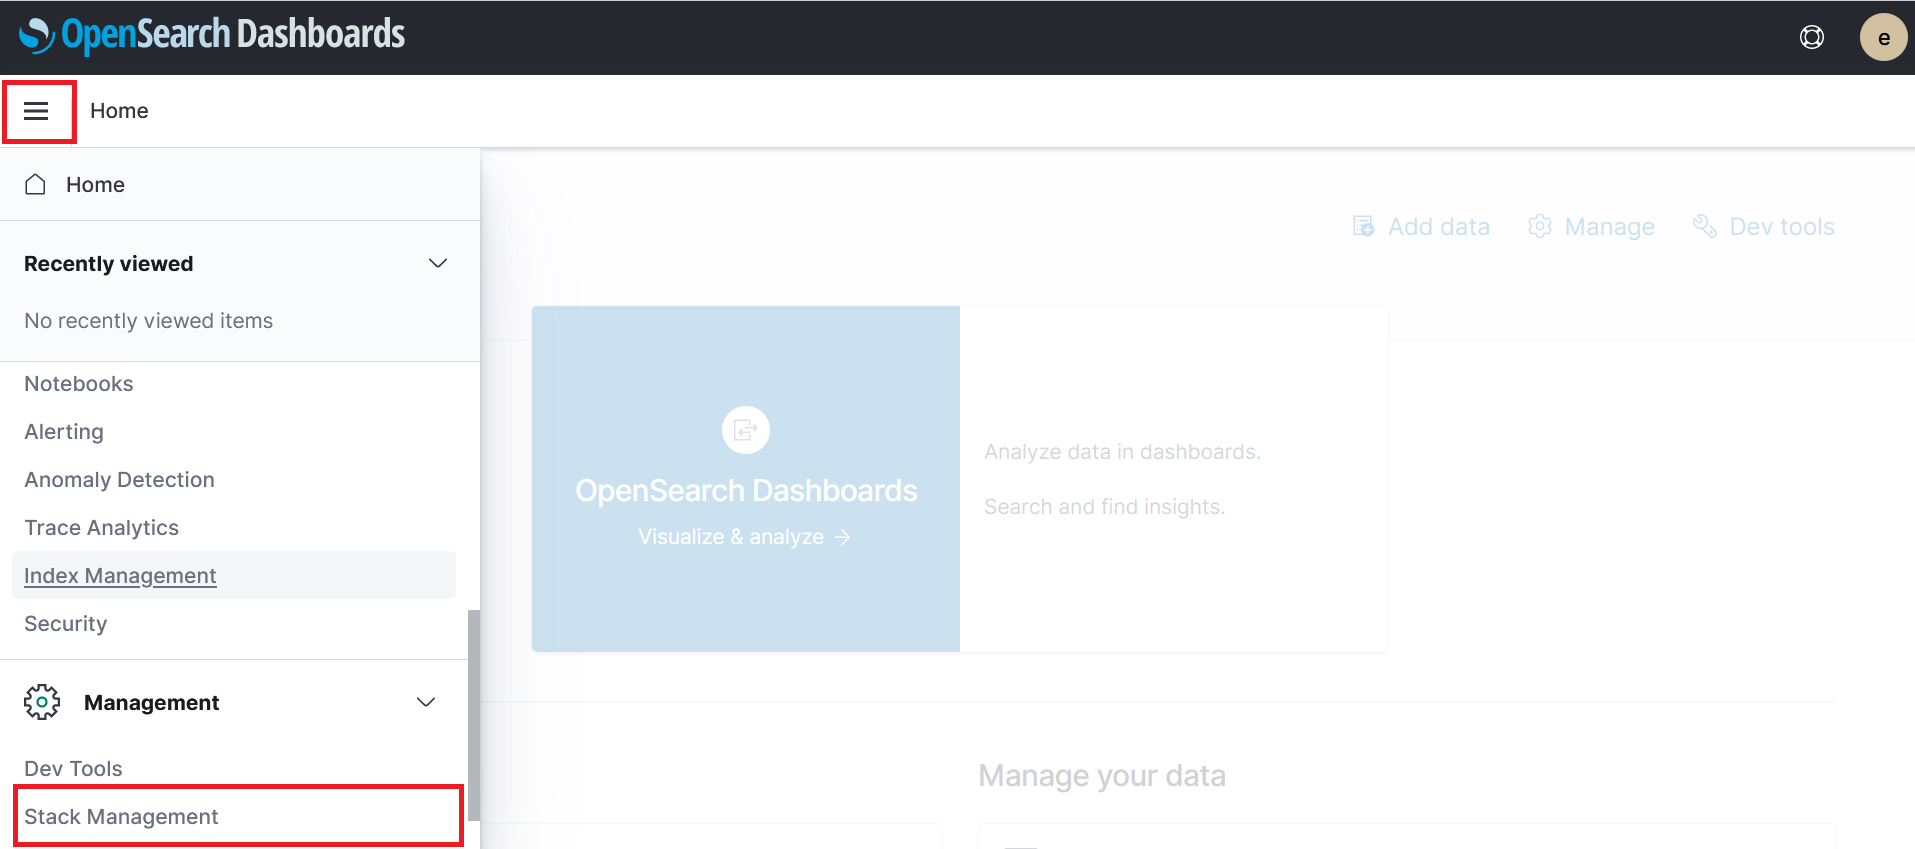
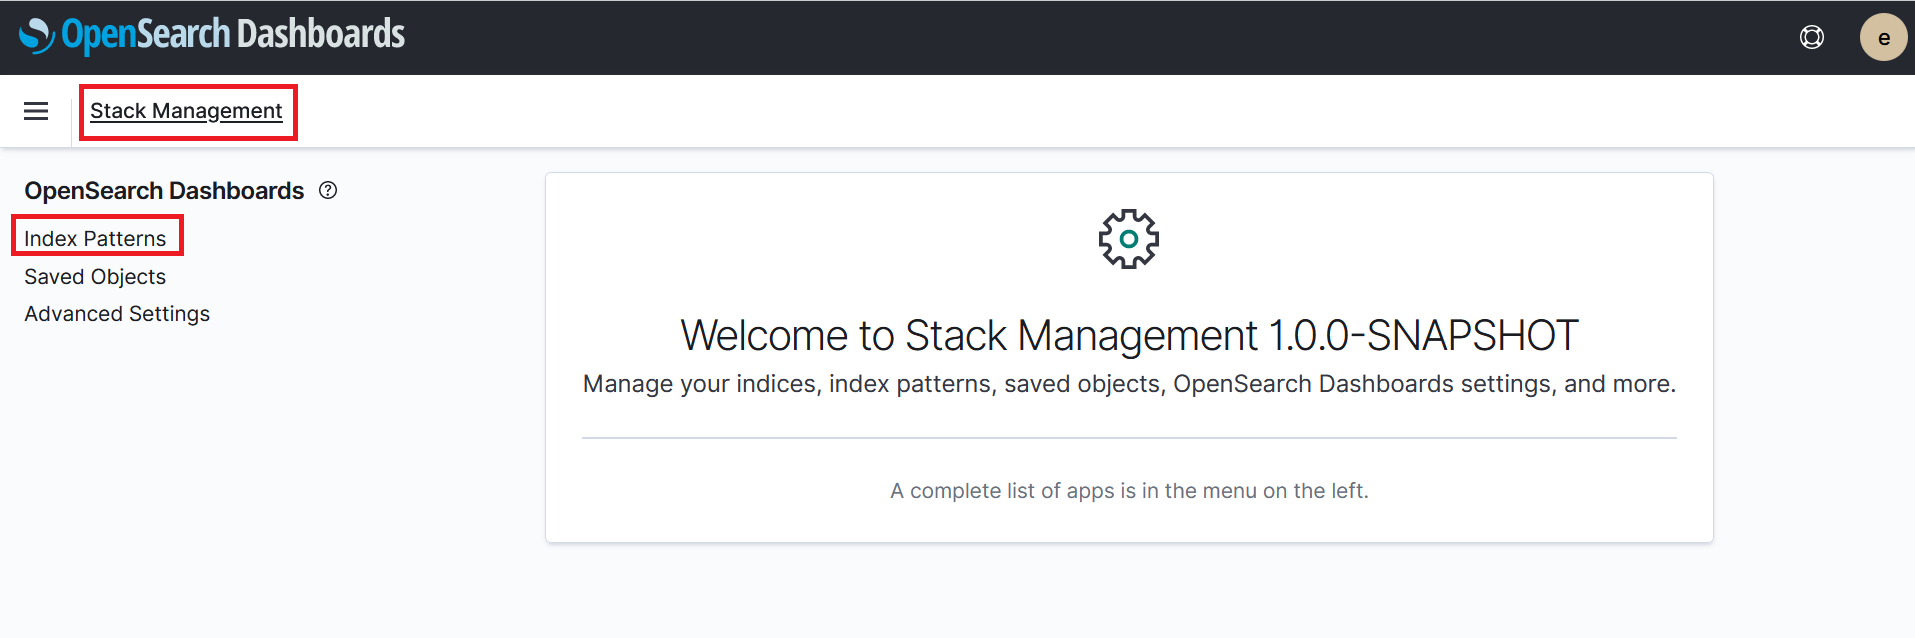
- In the OpenSearch Dashboard, expand the side menu and click on Stack Management under management section
- On the stack management page click on Index Patterns on the left hand menu
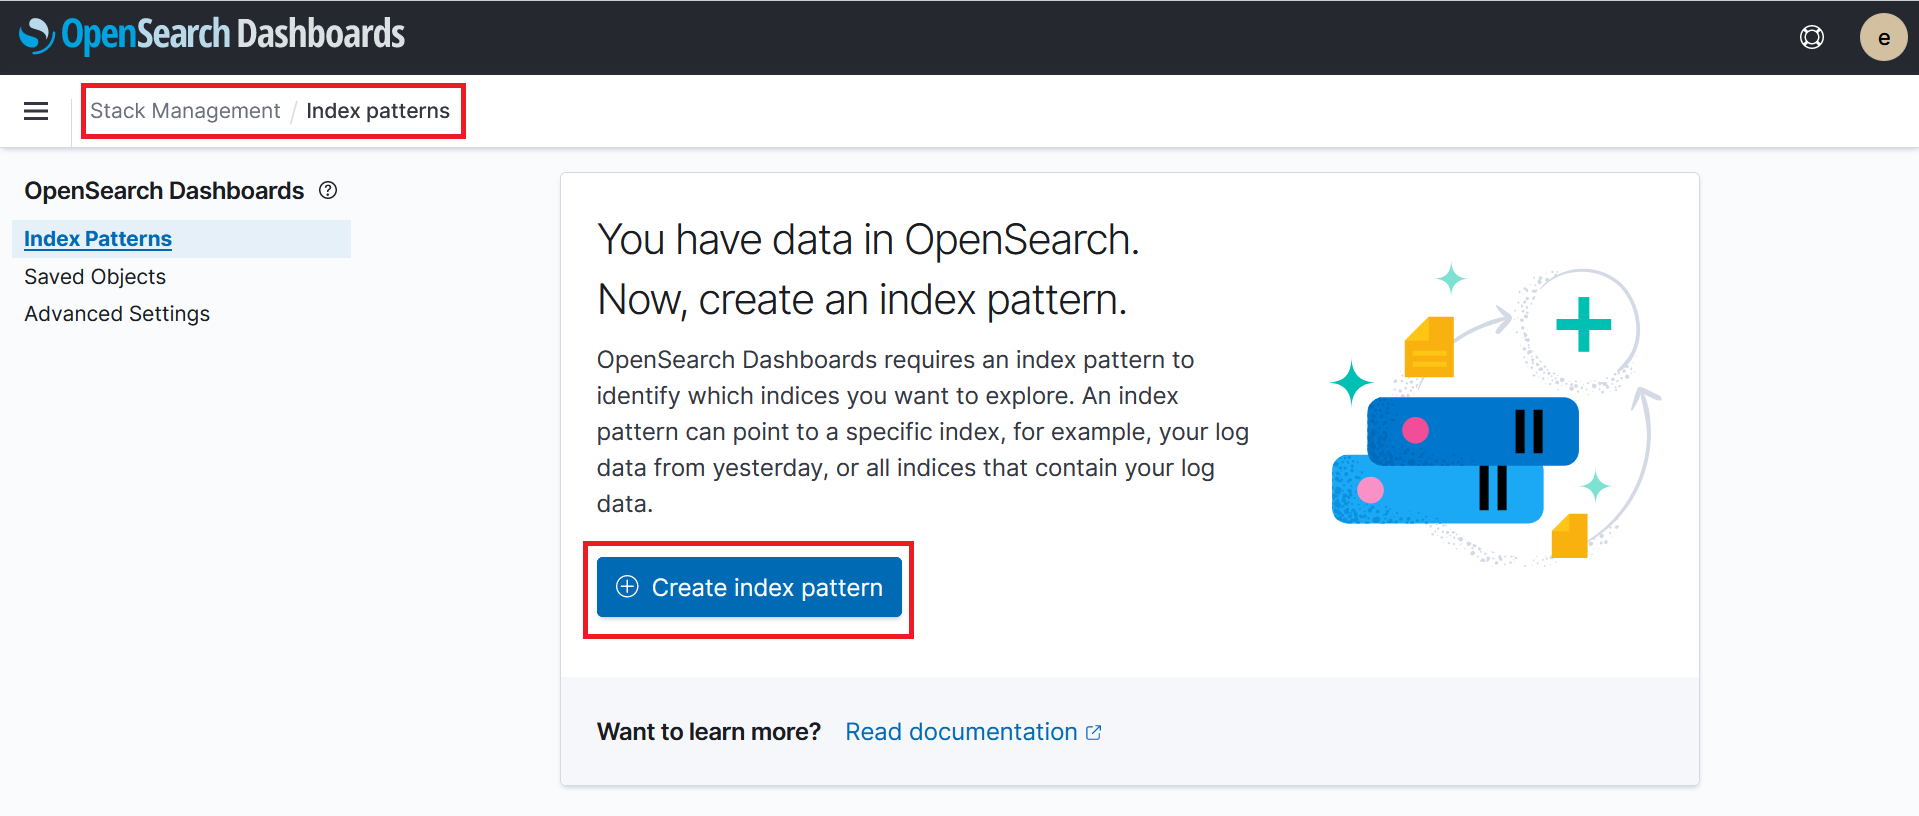
- On the index patterns page click on Create index pattern
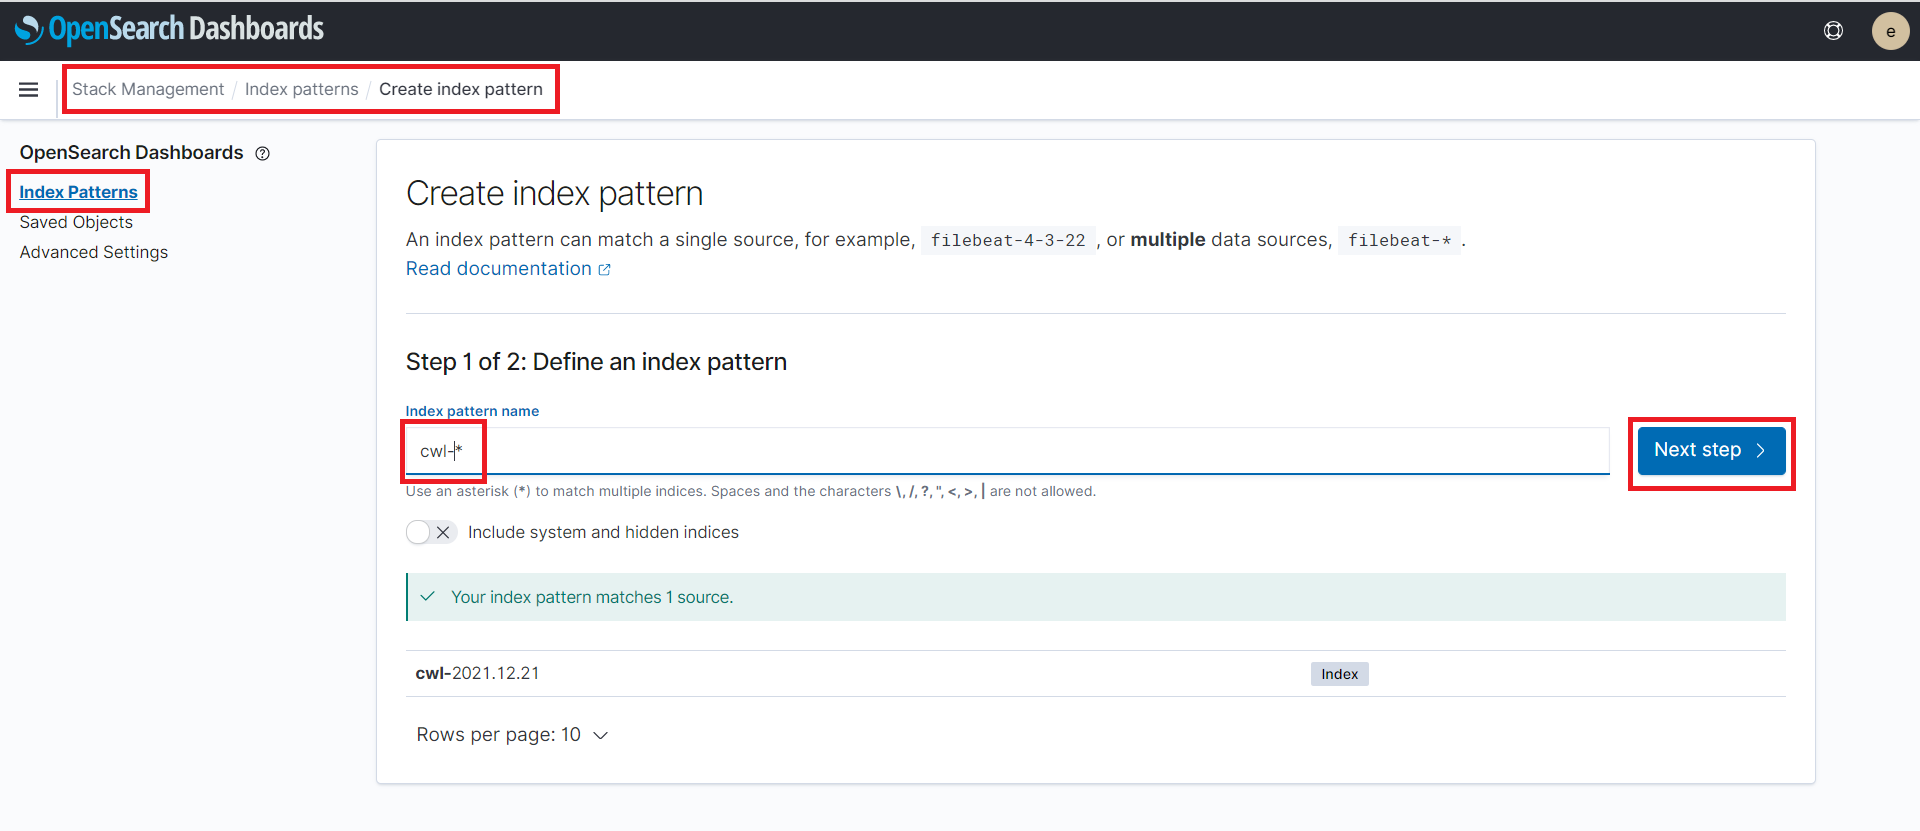
- Enter
cwl-*under the index pattern name section - Click on Next step
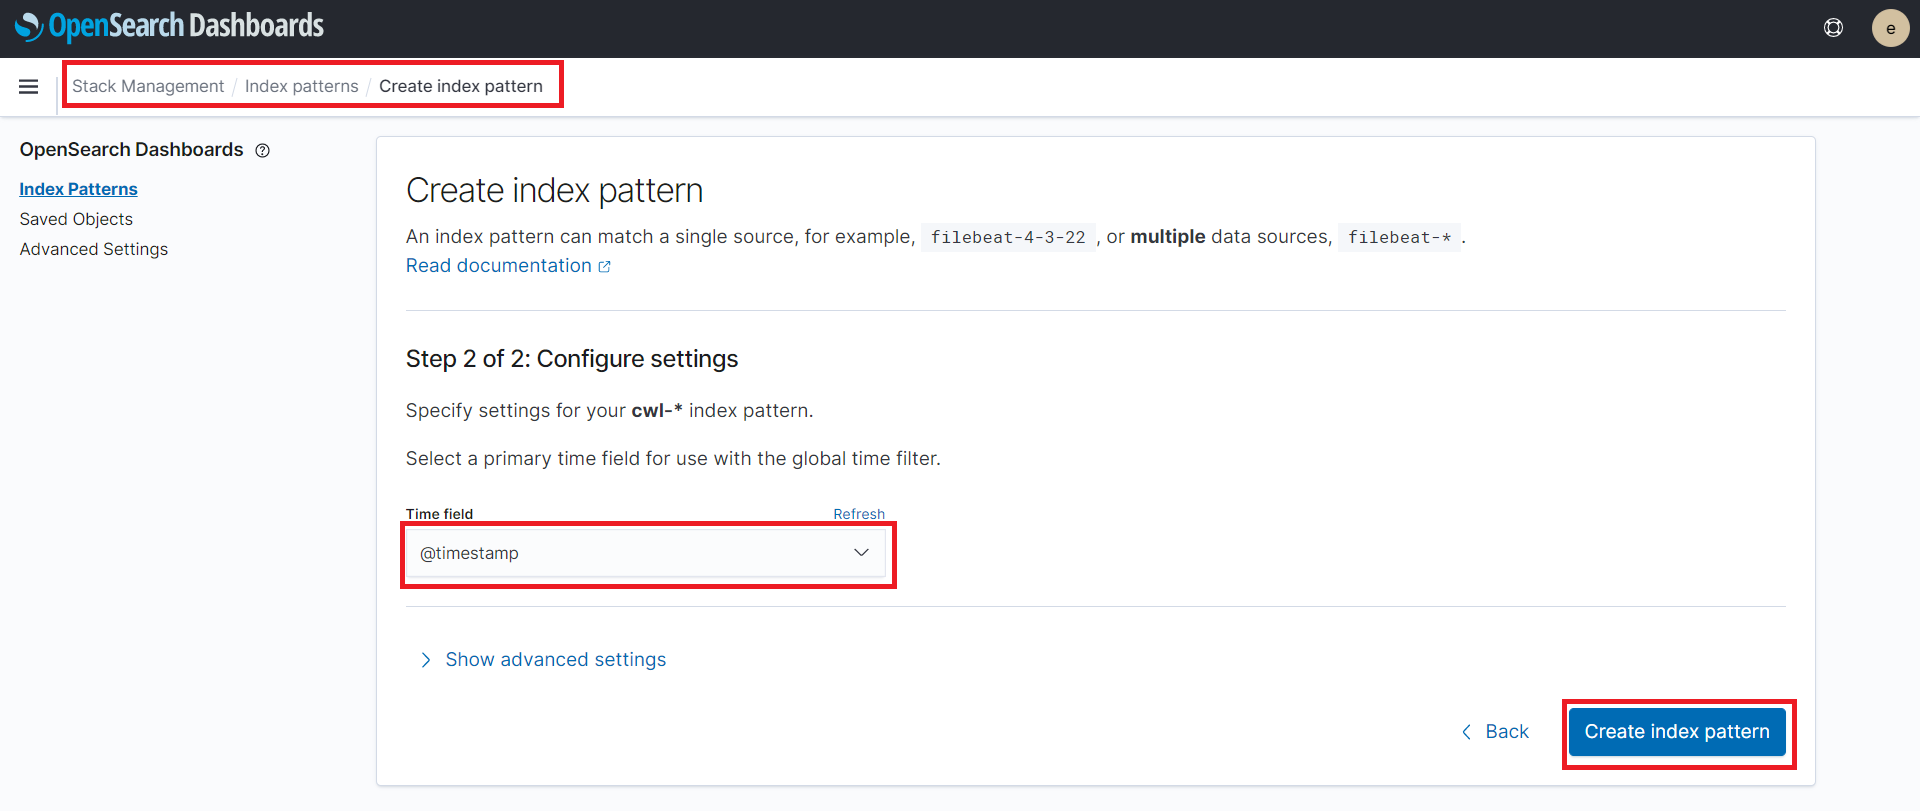
- Select
@timestampas the primary time field - Click on Create index pattern
We have now created an index pattern! We can use the index pattern to analyze our logs
Search the Logs
OpenSearch provides the ability to easily search log data. Lets run a simple search on our logs to validate that they have been successfully sent from CloudWatch to OpenSearch.
The Glue Jobs that you ran earlier logged custom message of Success!! and Error!!
We can search for the Success!! logs
- In the OpenSearch Dashboard expand the side menu and click on Discover under the OpenSearch Dashboards section
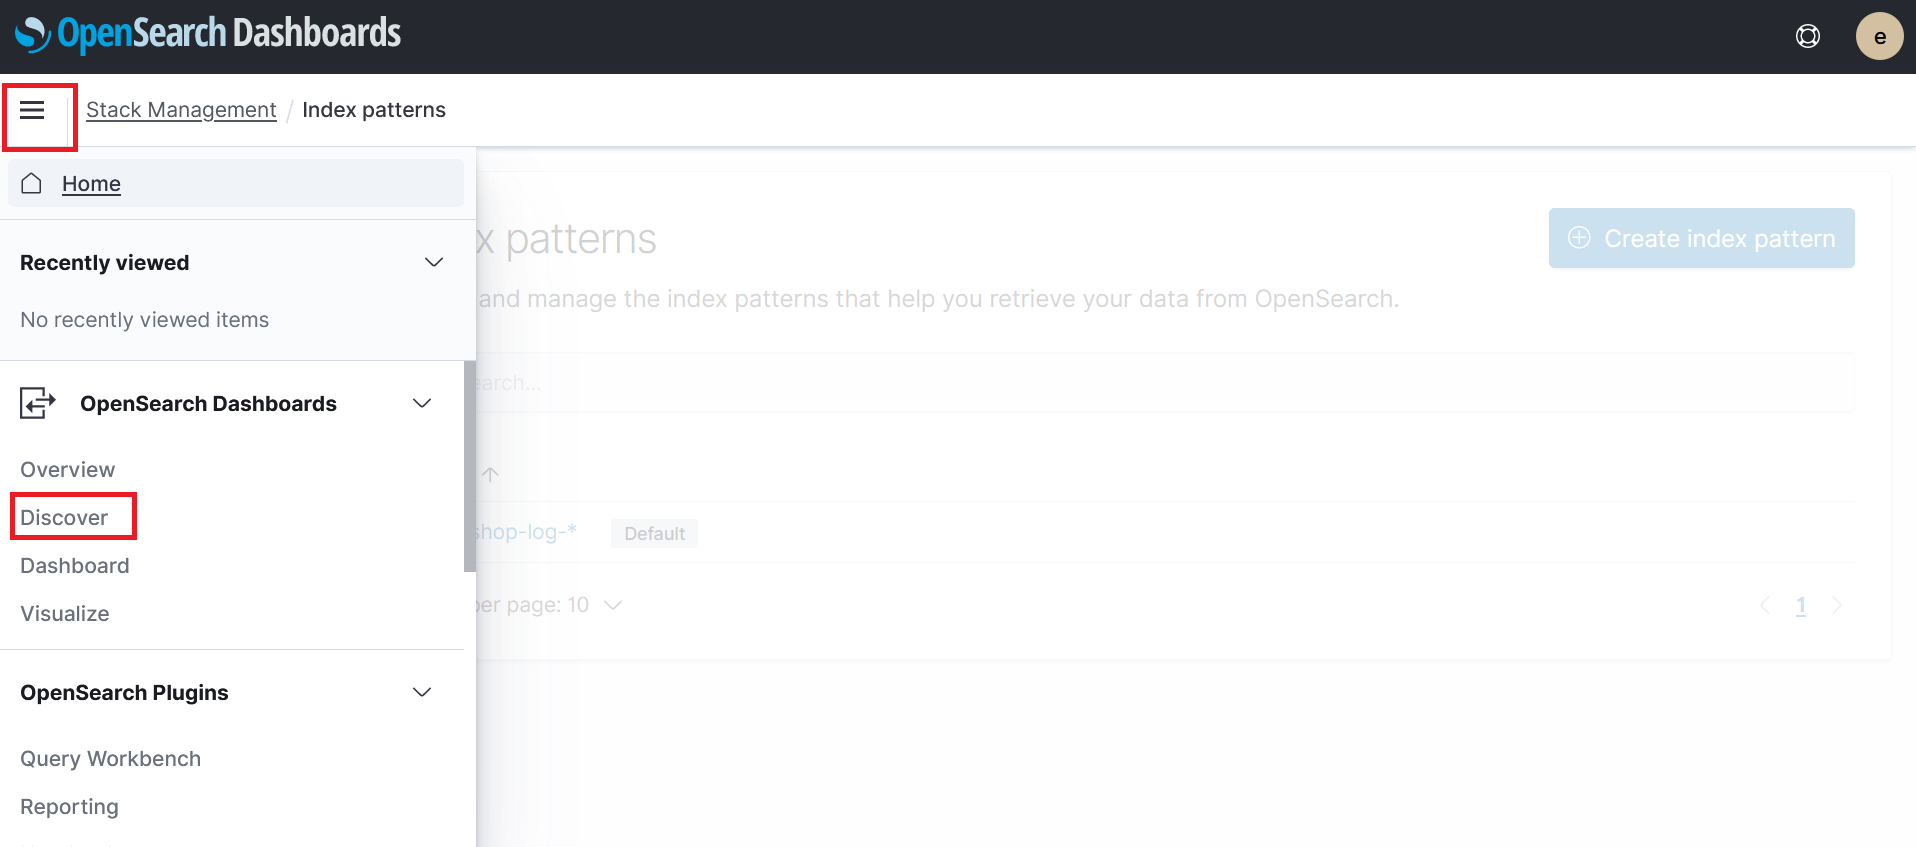
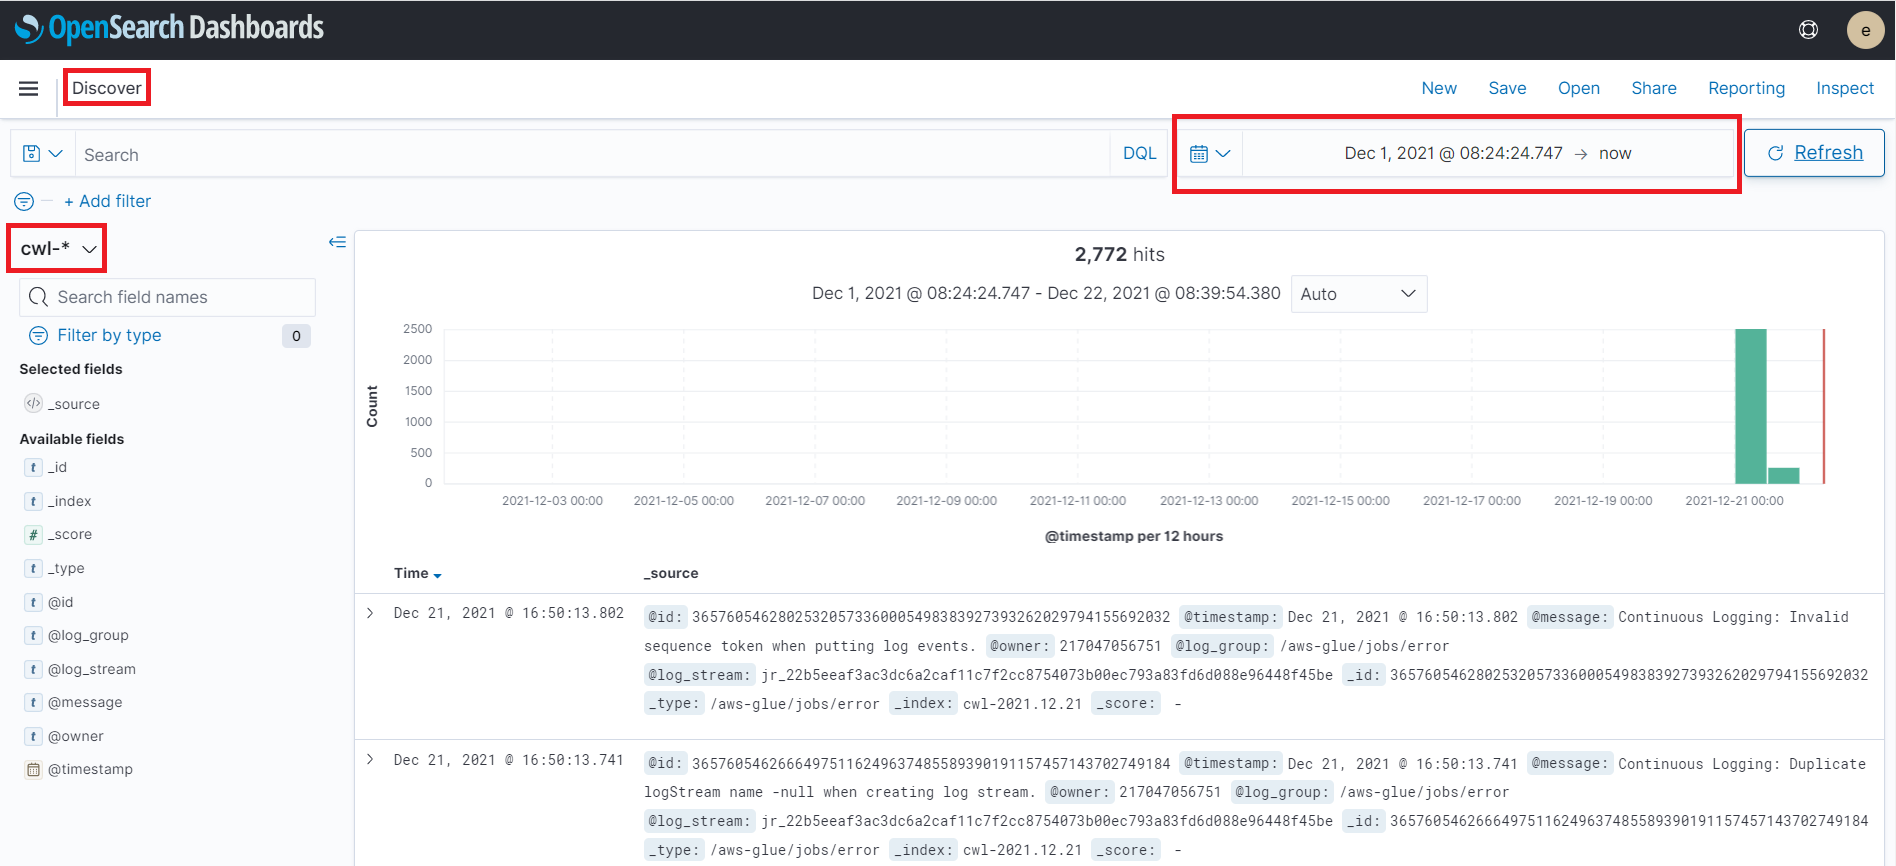
This will bring you to the discovery page. On this page we can see the log data sent from CloudWatch
- Ensure that you adjust the time range in the top right hand corner to include a large enough range that all of the logs we collected are included. Click Update or Refresh once you update the time range
- We can now search our CloudWatch logs. Try searching for
Success!!you will see the log message that the Glue job created during its execution
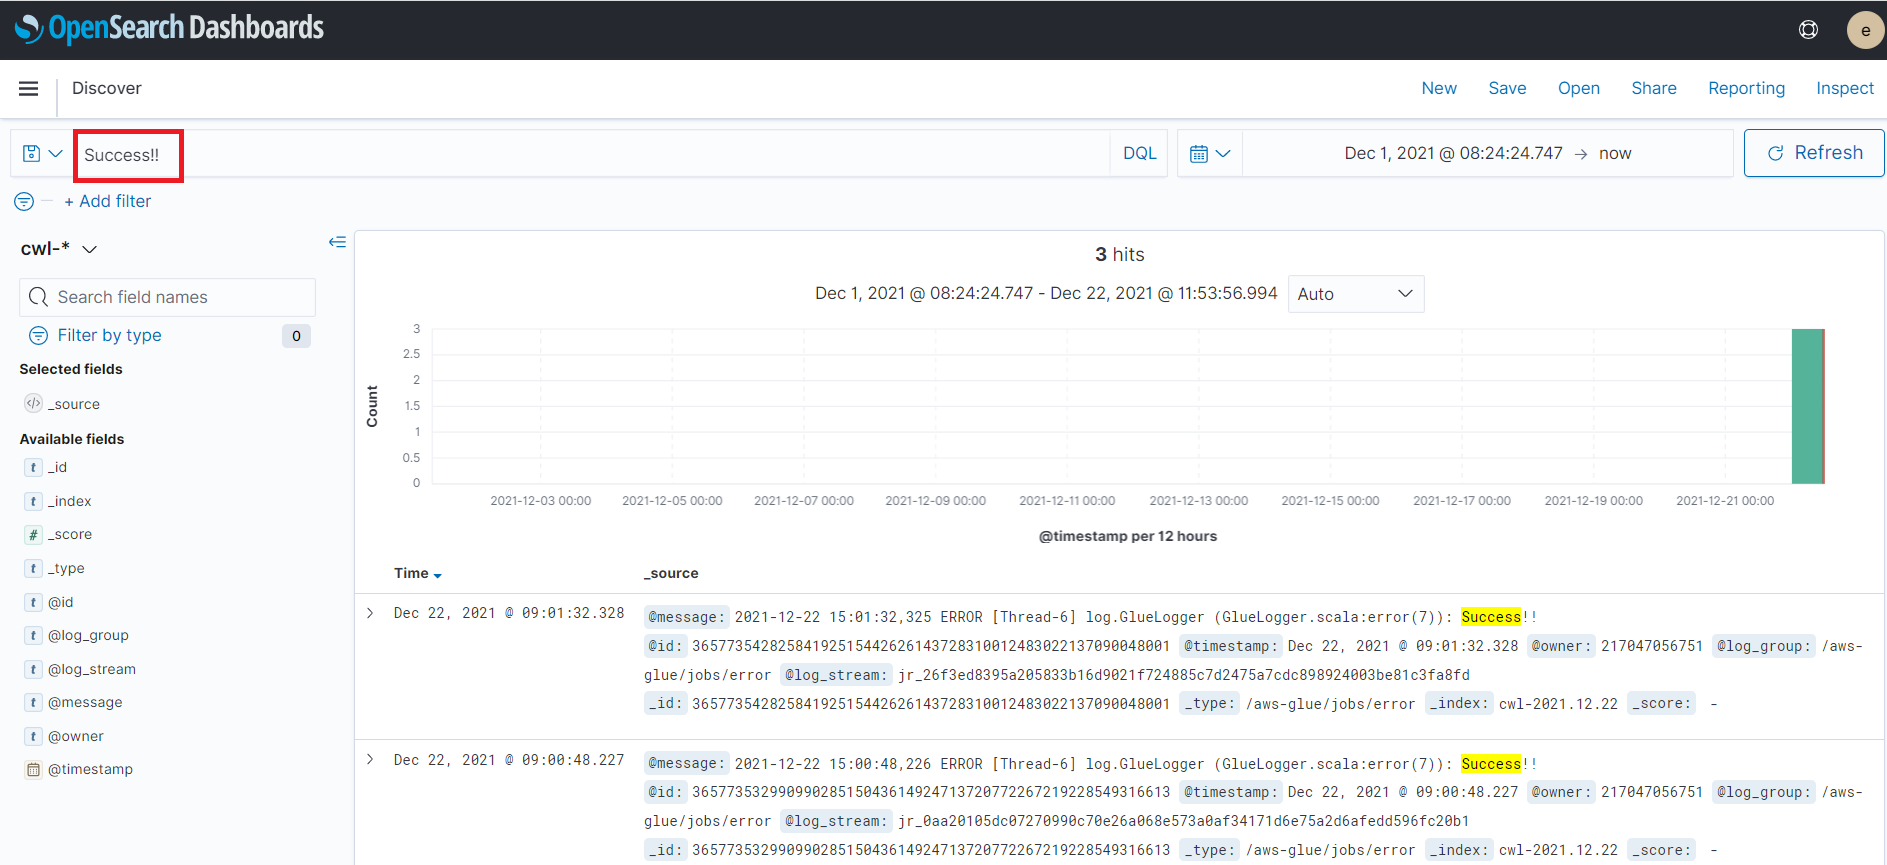
You will see a few logs that contain the customer log message from the Glue Job. Feel free to spend a few minutes trying other OpenSearch searches. See if you can search for the other Error!! logs
When you are ready proceed to the next step Clean Up if you want to delete the resources we used for this workshop